Setting Up Your Analytics Dashboard is as Easy as 1, 2, 3
*NOTE: Analytics reports is a permission-based feature. If you would like to add this reporting feature to your account, please contact your Account Manager for pricing.
1. Navigate to portal.clarityvoice.com, you should see the login page:
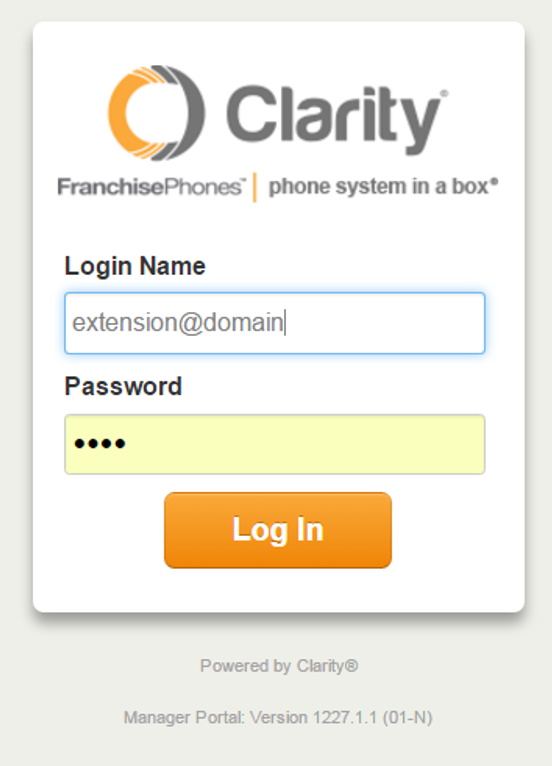
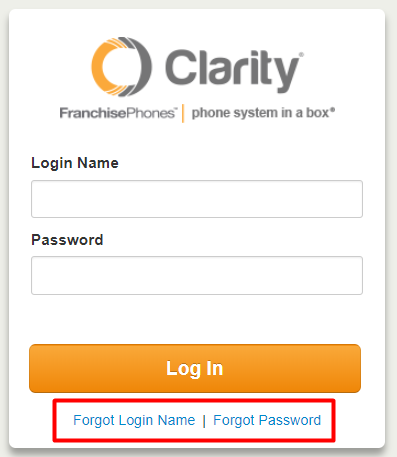
2. Enter your Extension and Domain, for example, 200@handyman, along with your password. If you don’t know your password, click Forgot Password to have a password reset email sent to you. Click Login.
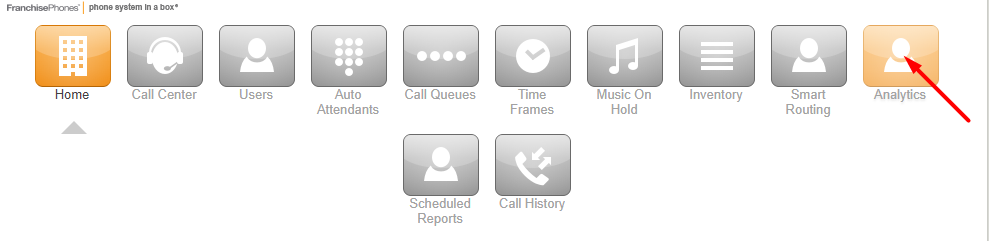
3. The main landing page has several tabs, click the Analytics tab.
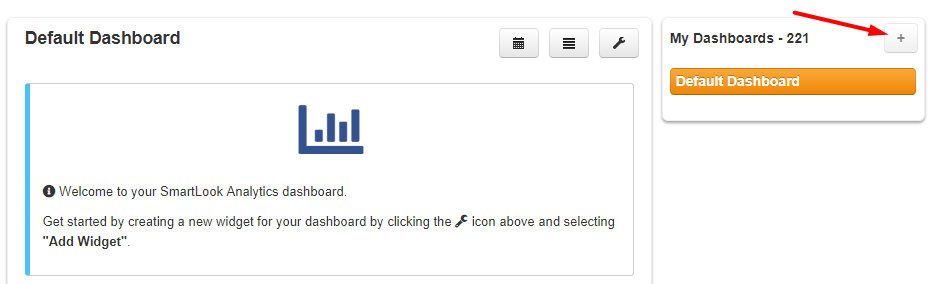
Creating a Dashboard
- To create a new reporting dashboard, click the ‘+‘ icon in the right menu
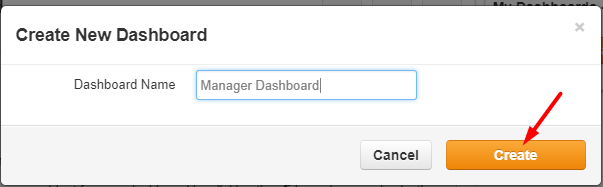
- Name the Dashboard, then click Create.
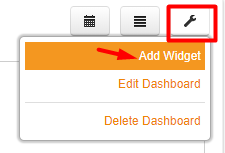
Creating a Widget
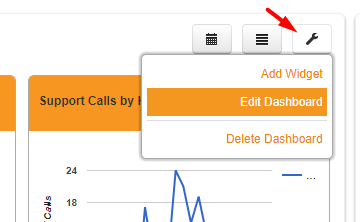
- Hover over the wrench menu and select Add Widget.
- Choose the type of Widget you would like to create.
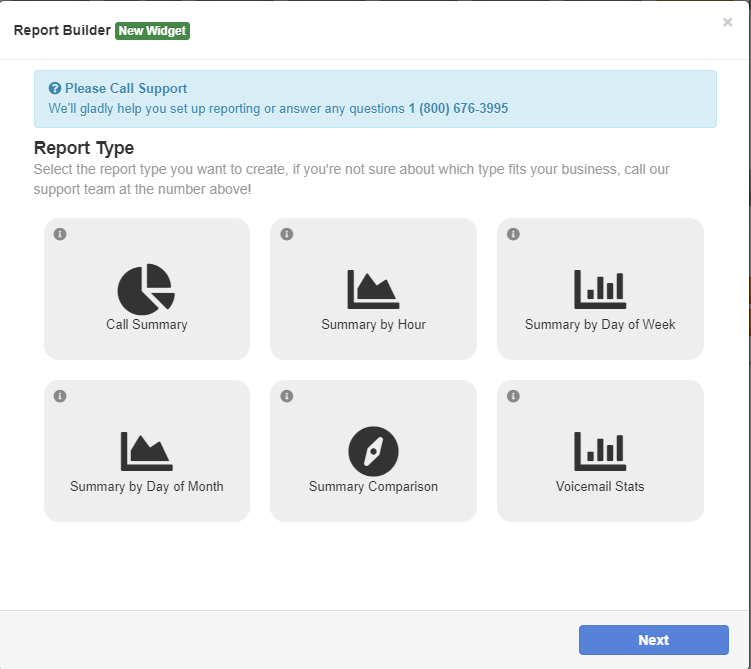
- Click Next.
- Select Date Options:
- Common Date Intervals: today, yesterday, this week, last week, this month, last month; or
- Customer Date Interval: day, week or month
- Click Next
- Select the Group Options:
- User – can be an employee or Call Queue
- Department – departments must be created for users
- Marketing Numbers
- Click Next
- Select the Call Type:
- Inbound on-net – An incoming call initiated from within the same company, no matter the final destination (e.g. missed call, voicemail or answered)
- Inbound off-net – An incoming call initiated from outside the company, no matter the final destination (e.g. missed call, voicemail or answered)
- Outbound on-net – An outbound call to someone within the same company
- Outbound off-net – An outbound call to someone outside the company
- Missed on-net – An incoming call initiated from within the company, that is not answered by a User, Hung Group or a Call Queue. Does not include calls that redirect to voicemail or voicemail escape.
- Voicemail on-net – An internal call that redirected to a user’s voicemail
- Voicemail off-net – An external call that redirected to a user’s voicemail
- Click Next
Advanced Options
This section allows you to customize your report by setting a custom name and filter.
- Widget Name – This field is left blank. Then a report name will be auto-generated for you. Otherwise, enter a friendly name for your report (e.g. Inbound Calls This Week)
- Filters
- Combine Results – selecting this option will roll-up your report stats into a single data point (this is helpful when calculating the total number of calls across all selected groups)
- Custom Duration – filter by call duration (e.g. filter out outbound calls with less than 10-second duration)
- Click Next
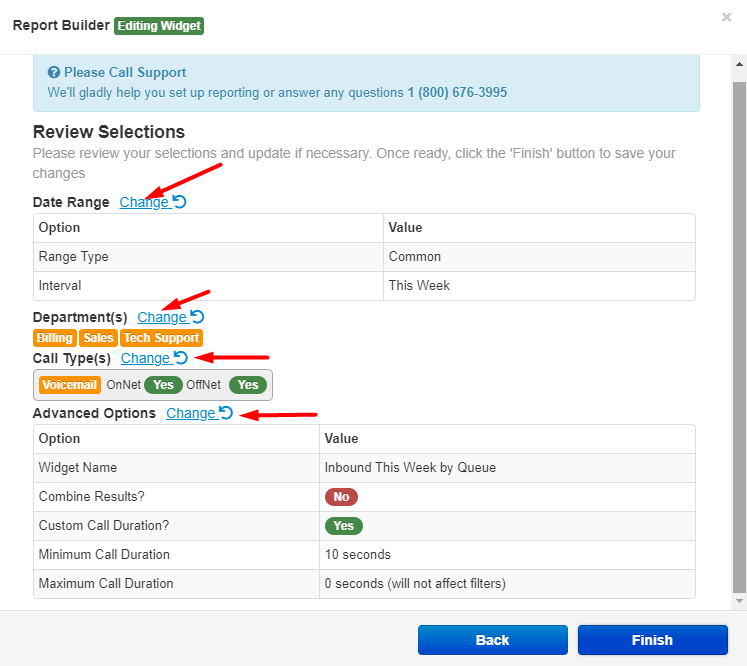
Review Selections
This section allows you to review your selections and update each section by clicking Change, as necessary. Once ready, click the Finish button to save your changes.
Call Summary

Displays a pie chart that breaks down a summary of all calls for a set of Users, Departments, Marketing Numbers, and by Call Type.
Sample Reports – Over a period of time, the total and percentage of calls:
- Inbound to Marketing Number
- Inbound to Call Queues or Department
- Outbound Calls per Employee
- Number of Calls to Voicemail per Department or Employee
- External Missed Calls by Employee or Department
Summary by Hour

Allows you to view your call volumes by hour. Call data can be filtered by Users, Departments, Marketing Numbers, and Call Type.
Sample Reports –
- Inbound by Hour per Employee or Department
- Outbound by Hour per Employee or Department
- Missed by Hour per Employee or Department
- Voicemails by Hour per Employee or Department
- Inbound by Hour per Marketing Number(s)
Summary by Day of Week

Allows you to view your call data by day of the week. Call Data can be filtered by User, Department, Marketing Numbers, and Call Type.
Sample Reports –
- Inbound per Employee, Department, or Marketing Number
- Outbound per Employee or Department
- Calls to voicemail by Employee, Department or Marketing Number
Summary by Day of Month

Allows you to view your call data by day of the month. Call data can be filtered by Users, Department, Marketing Numbers, and Call Type.
Pro Tip: Use ‘Combine Results’ for Department Summaries.
Sample Reports –
- Last Month Inbound per Employee, Department or Marketing Number
- This Month Outbound per Employee or Department
- This Month Calls Answered by Voicemail per Employee or Department
Summary Comparison

Provides a method of tracking the call volume for a specific User or Marketing Number and comparing against the average number of calls.
Sample Reports –
- Compare one User’s inbound calls vs. all calls average
- Compare one User’s outbound calls vs. all calls average
- Compare calls to one Marketing Number vs. average calls in same time period
Voicemail Stats

Provides data on all voicemails both returned and not returned within 24-hours of initial call. Call data can be filtered by User or Department.
Sample Reports –
- Voicemails not returned by User
- Voicemails not returned by Department
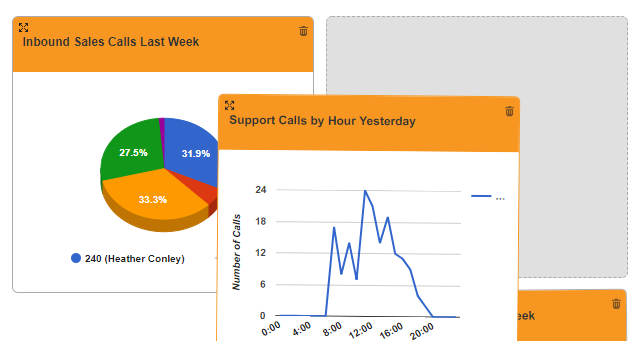
Sorting Widgets and Dashboards
At any time, widgets can be sorted allowing you to keep your most critical information at the top of the dashboard. To sort, follow the steps below:
- Rollover the wrench menu and select Edit Dashboard
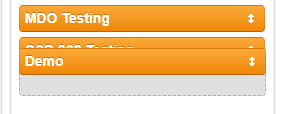
- Drag the widget to the new location on the page or drag the dashboard up or down to a new location
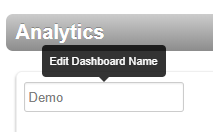
- Dashboards can also be renamed from this edit screen
Sorting a Dashboard
Sorting a Widget
Expanding Widgets
Expanding a widget will show you more details about the widget data in addition to enlarging the chart. To expand a widget, simply click the magnifying glass icon in the upper right corner of the widget. This will enlarge the widget as shown below. While the widget is expanded, you have access to print or download a .csv file of the data.

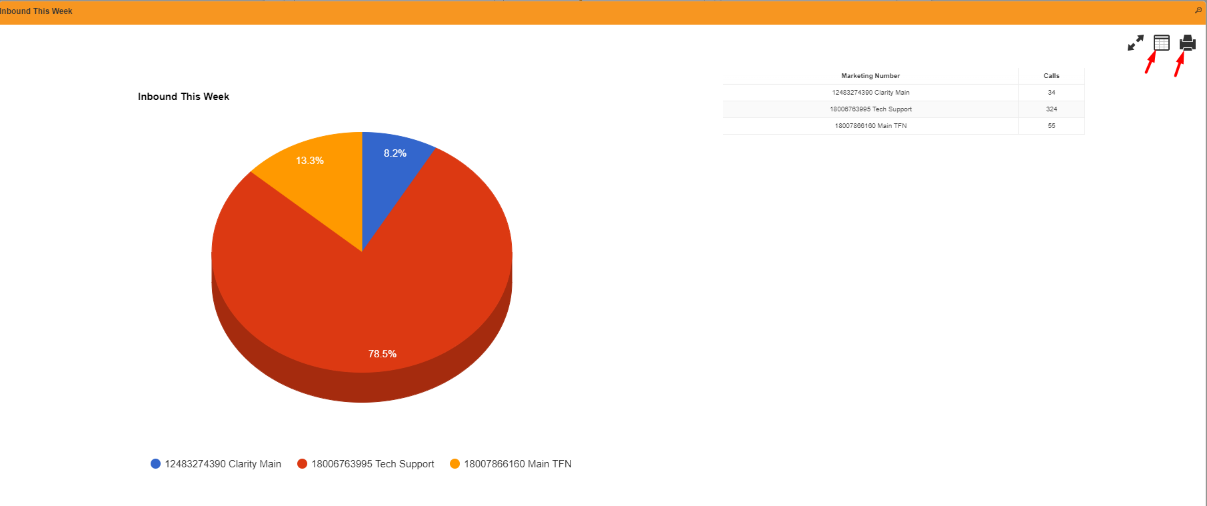
Dashboard Details View
This feature allows you to view an expanded summary for all widgets in a specific dashboard at the same time as well as giving you the ability to print the data display. Before printing you can click on specific points in the data or sort the tables. This allows you to focus on important metrics for the printed reports.
- To view the Dashboard Details report, click on the
 icon
icon - To print the Dashboard Details report, click the
 icon
icon
Setting a Custom Date Range for a Dashboard
- Click on the
 icon and the date filter fields will become visible
 - Select a start and end range for your widget data
- Click the Update Results icon
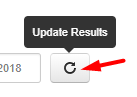
- Click the Update Results icon
- Your widgets will update their data to show only call events that happened within your start and end date ranges. *NOTE: Custom date ranges will only affect the currently selected dashboard and will not persist if you log out and back into the system.
Deleting a Widget
- Hover over the wrench menu and select Edit Dashboard
- Click the
 icon and then click OK when prompted

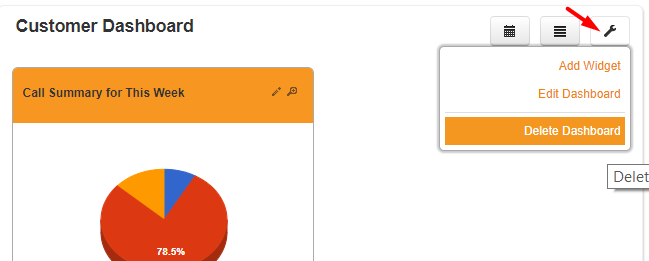
Deleting a Dashboard
- Hover over the wrench menu and select Delete Dashboard
- Confirm that you want to delete the dashboard by clicking Delete when prompted